WHAT IS AN INFOGRAPHIC?
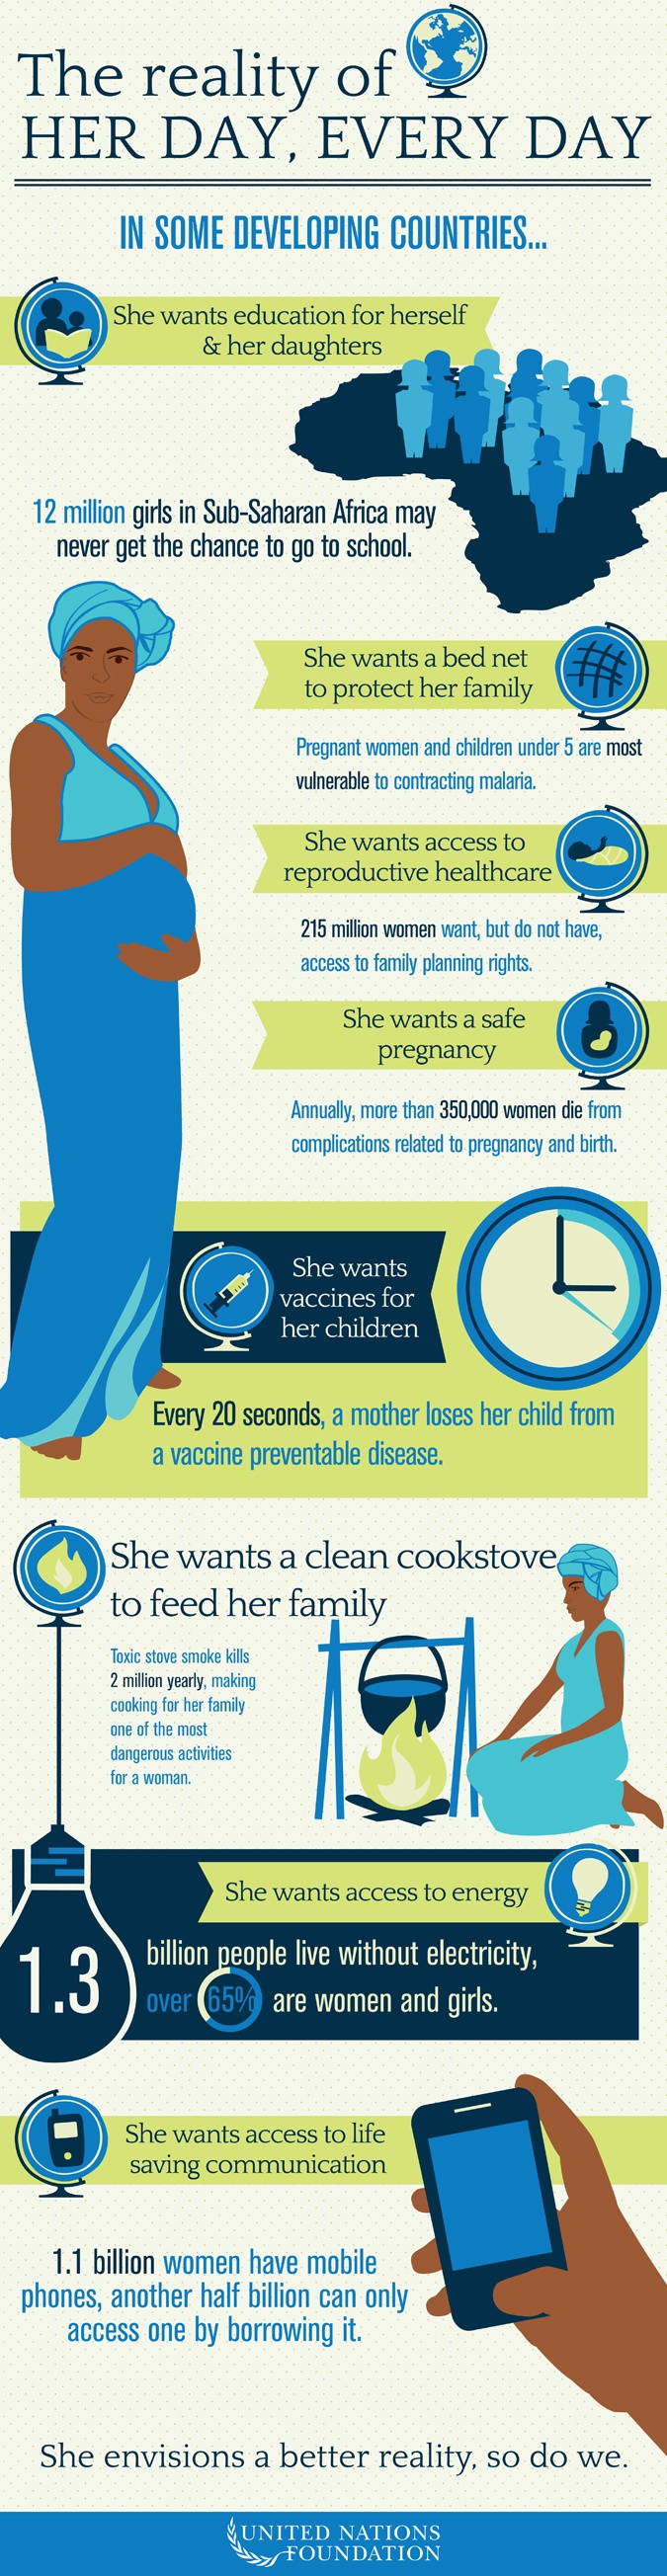
Here is an example of a compelling infographic:
Getting Started
YOUR PURPOSE: Before starting your infographic, make sure you have an understanding of your target audience and your purpose behind creating an infographic:
- WHO are you looking to educate and inform?
- WHAT are you looking to educate and inform about?
- WHY are you looking to educate and inform?
YOUR FORMAT: There are many different types of infographic formats you can use, but depending on what you are looking to communicate, you’ll probably find that one type is more suitable for your needs over another. You may also find that a combination of infographic types in the same infographic can be used based on your needs.
- List: support a claim through a series of steps
- Comparison: compare two things in a head-to-head study
- Flowchart: provide an answer to a question via reader choices
- Visual Article: make a piece of writing more visual and interesting
- Maps: showcase data trends based on location
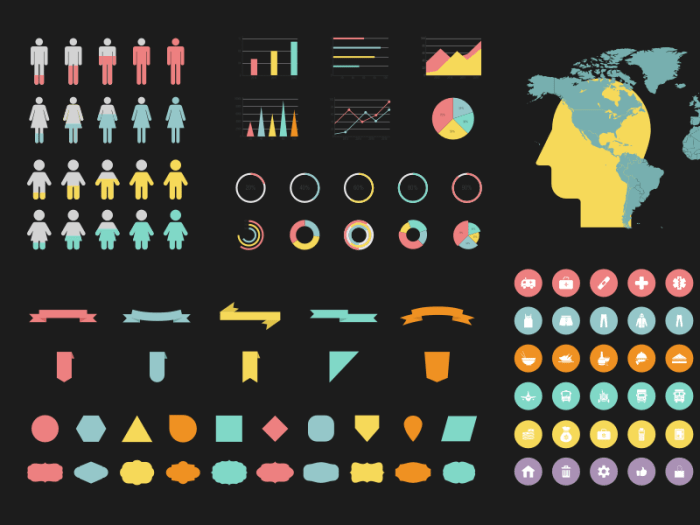
- Data Visualization: communicate data through charts, graphs, and/or design
- Timeline: tell a story through chronological flow
YOUR PROCESS: When you’re ready to get started, the following steps can guide you through the process of creating an infographic:
Create an Outline
- Consider your audience
- Create a thesis or a question
- Focus or Narrow Topic Down
- Tell a Story with your data
Design Your Infographic
- Be brief and use graphics (keep imagery simple)
- Limit your color palette and fonts (two fonts is enough)
- Is it viewable and legible (be consistent with style choices)
- Remember whitespace is a good thing
Ensure the Quality
- Use accurate data
- Credit your sources
- Sign it or credit yourself
Resources For Creating Infographics
You can this free ebook to learn how to create Infographics to engage your audience in a whole new way. Then, try out one of the websites below to get started!

Pingback: PSA’s – For Students